Black Birch Farm Apiaries Research Weekly Data Updates:

Week of August 4 through August 10, 2024


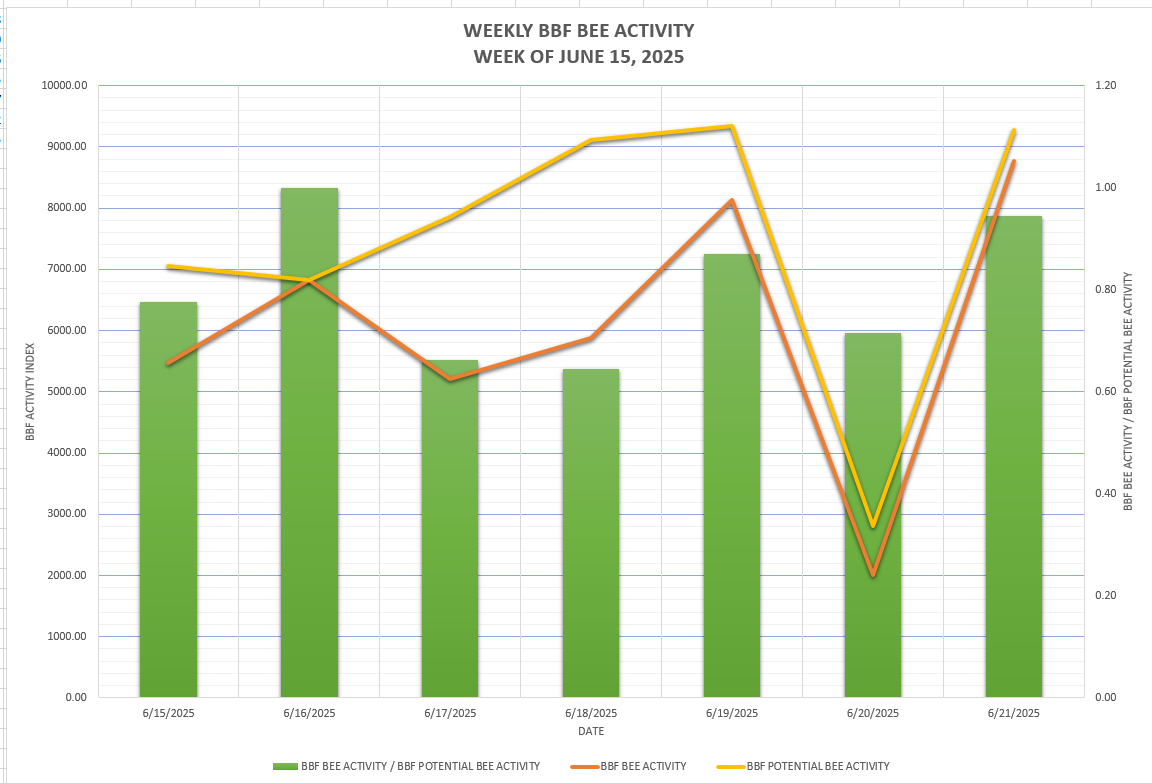
Weekly Summary Bee Activity Index

Weekly Summary Bee Activity Index

The Bee Activity Index is published on the website daily for the previous day and it also summarized here on a weekly basis. Our Bee Activity Index is based on our weather information and our close range photogrammetry at the beehive entrances. The larger the number the greater the potential bee activity as controlled by meteorological conditions.


Precipitation vs. Evapotranspiration

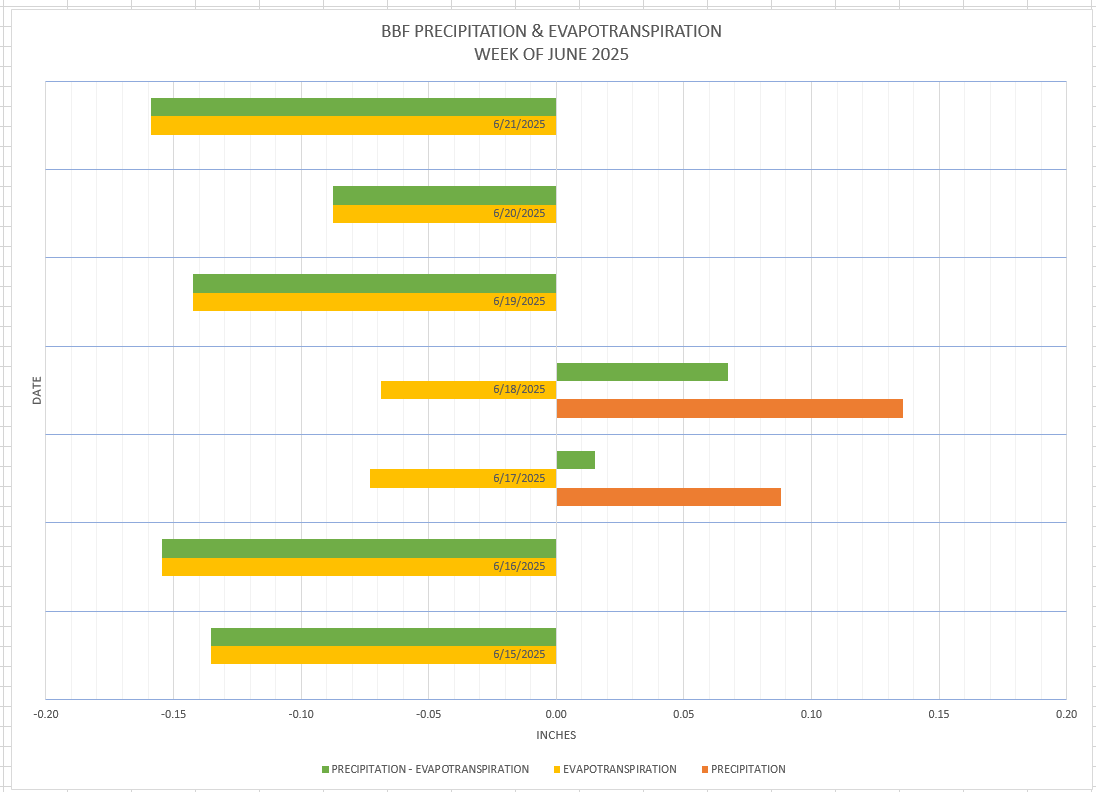
Weekly Precipitation vs. Evapotranspiration:

This chart shows the amount of precipitation (moisture incoming) to evapotranspiration (moisture outgoing) plotted on a daily basis for the week. If the evapotranspiration exceeds the precipitation value it indicates a negative moisture balance which can effect nectar flow and perhaps the need to provide water to hives.At Black Birch Farm Apiaries we monitor Soil Moisture, Precipitation, and Evapotranspiration to determine moisture stress on both hive activity and nectar flow.
Cumulative Precipitation vs. Evapotranspiration

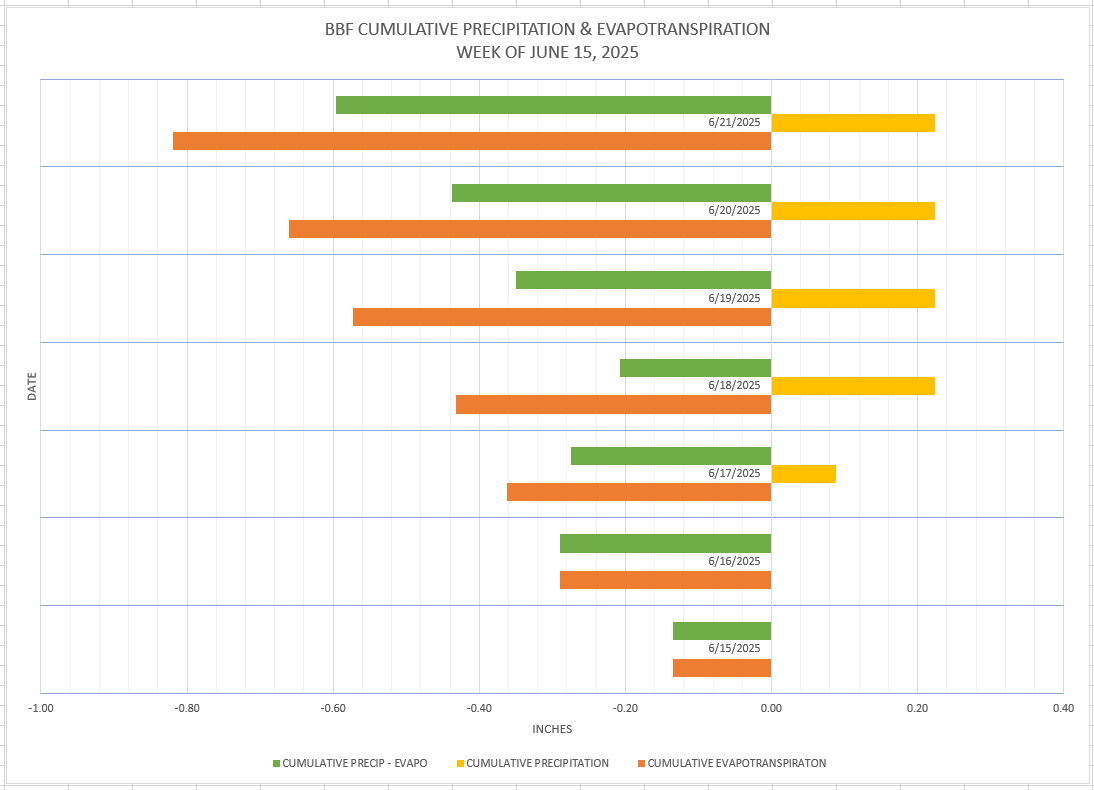
Weekly Cumulative Precipitation vs. Evapotranspiration:

This chart shows the amount of precipitation (moisture incoming) to evapotranspiration (moisture outgoing) plotted CUMULATIVELY on a daily basis for the week. If the evapotranspiration exceeds the precipitation value it indicates a negative moisture balance which can affect nectar flow and perhaps the need to provide water to hives.At Black Birch Farm Apiaries we monitor Soil Moisture, Precipitation, and Evapotranspiration to determine moisture stress on both hive activity and nectar flow.

Soil Moisture & Drought Monitoring

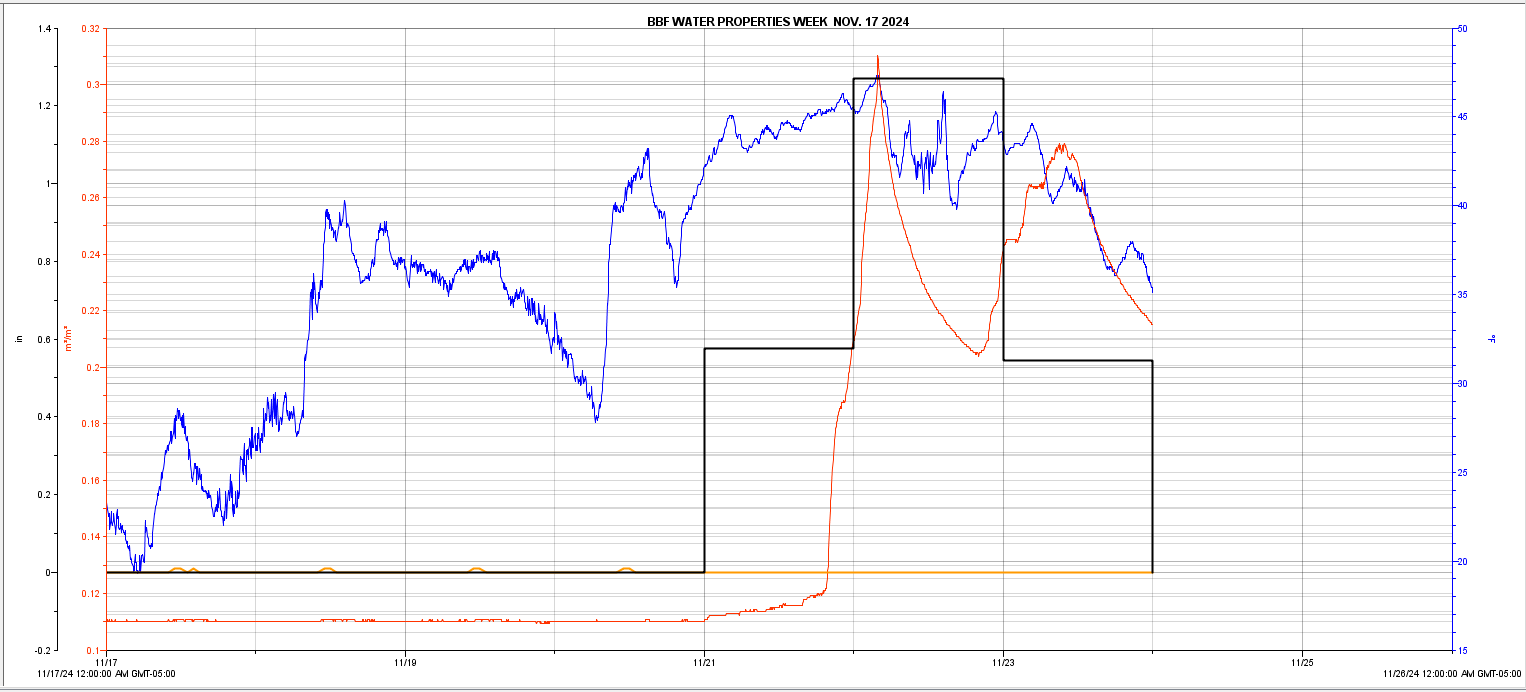
Weekly Soil Moisture and Drought Monitoring:

At Black Birch Farm Apiaries we monitor Soil Moisture, Precipitation, and Evapotranspiration to determine moisture stress on both hive activity and nectar flow. This information is posted on a weekly basis. Note: During winter months select data is unavailable

Blue = Dew Point Temperature

Green = BBF LEAF WETNESS (Wetness in Percent)

Red = BBF SOIL MOISTURE (Water Content in m3/m3)

Orange = BBF REFERENCE EVAPOTRANSPORATION (Reference ET in Inches)

Black = BBF RAINFALL (Max Rain in Inches)


2024 Bee Season - Growing Degree Days (GDD)

AVAILABLE ON OUR SEASONAL REPORTING PAGE

2024 Bee Season - Growing Degree Days (GDD):

At Black Birch Farm Apiaries we monitor Temperature, Rainfall, Cumulative Precipitation & Evapotranspiration to determine moisture stress to determine Growing Degree Days (GDD) and their affect on both hive activity and nectar flow. This information is posted on a seasonal basis. Note: During winter months select data is unavailable.